There is no business or marketer in the world who doesn’t want to see higher conversion rates, but yet many businesses and marketers base their conversion optimization strategies on guesses and intuition rather than solid evidence.
One of the leading heat mapping software providers, CrazyEgg, ran a study in early 2015 and found that 63% of marketers optimize websites based on best practises and intuition.
While some of these best practises may have worked, all websites are different, and there is no better way to optimize your website than by using your own visitor statistics to do so.
There are plenty of visitor statistics you can use to optimize your website for conversions such as heat mapping, surveys, internal site search activity, landing page interaction and more.
I will go through each of these and explain how each can lead to a better conversion optimization strategy.
How Visitors Enter And Interact With Your Website

Image Source: DriveSEOTraffic
One of the first things you should be looking at is how visitors come to your website and how they interact with it once they have landed.
An important thing to remember is that not all website visitors will land on your homepage so make sure all other pages are conversion focused too.
As well as landing on different pages, they will also come from different sources, locations and will be in different age groups, use different devices, have different levels of intent and more.
You can use Google Analytics to find out which landing pages are performing the best and worst, which sources of traffic are performing the best and worst, which visitor demographics performs the best and west and so on.
Additionally, when using ClickFunnels the analytics dashboard allows you to see how your split tests are performing also.
Popular Landing Pages
You can use Google Analytics to find out the most popular pages that visitors are landing on, and the statistics for each of those pages such as bounce rate, average time spent on your website and the average conversion rate.
You can find all this data by going to “Behaviour > Site Content > Landing Pages” in Google Analytics.
You can sort this data by conversion rate and change the sort type to “weighted” so that only those pages that get a decent amount of traffic will show.
You can get an idea from this data that pages high traffic landing pages are performing the best and which are seeing the most drop-offs.
Comparing Statistics
You can use the different statistics for each of the most popular landing pages to delve deeper and understand their performance in more detail.
There are some different landing page statistics to take note of when determining which landing pages are performing and not performing.
These are:
- Bounce Rate – This is the amount of visitors who land on the page and leave without visiting any other pages on your website. This is a key indicator in telling whether visitors find the information or product they are looking for. If they do, they will carry on browsing, and you will have a low bounce rate. If they don’t, they will click the back button and go back to the search results and click on a competitor instead.
- Pages/Session – This is the number of pages a visitors browses through after the page they landed on. You can use this metric to compare with the overall average to determine which landing lead to better engagement and which do not.
- Session Duration – This metric will tell you on average how long visitors spend on your website after landing on it. As with the Pages/Session metric, you will be able to determine which landing pages lead to further engagement and which do not.
- Conversion Rate – This is the most valuable metric and will tell you landing pages are generating the most conversions. You can use this metric on each landing page to compare against the overall average to determine which landing pages aren’t converting.
Separating Dimensions
Looking at the above statistics will give you a great overview of how landing pages are performing, however, as mentioned earlier because visitors are coming from different sources and have different demographics they will be expecting different things.
You can separate the landing page statistics by adding dimensions such as:
- Traffic Sources – This will separate statistics by the different sources visitors have come from such as Google, Facebook, Instagram and more.
- Traffic Medium – This will separate statistics by the different mediums visitors have come from such as Organic, Direct, Social and more.
- Campaign / Ad Group – If you are running paid campaigns or have set up other marketing campaigns you can separate the data to see which campaign or ad group has generated the most conversions.
- Country/City – This will separate landing page data by the location the visitors are from which is detected by the visitor IP address.
- Device Category – This will separate data by what mobile device type visitors are using to browse your website that will either be mobile, desktop or tablet.
Combining Heatmaps And Surveys

Image Source: StudioNEC
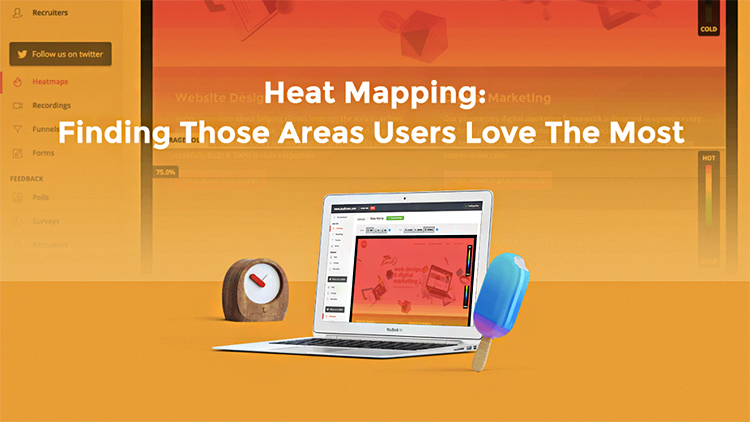
To get to know how visitors are using your website and to get detailed insights, using both heat mapping and surveys is the best strategy.
You will use both these tools to find out what the strong and weak points are on landing pages, which messages attract the most attention, whether highlight benefits or features lead to more conversions, and whether all elements of landing pages are of value or are optimized for conversions.
Understanding your landing pages in this much detail will lead to more educated hypothesis to split test rather than making changes based on guesswork and intuition.
Scroll Mapping
You will find a scroll mapping tool on CrazyEgg and will allow you to identify how far down visitors are scrolling and at which points they pause to read or interact.
Use this tool to find out which areas of the landing page are red hot and which are a cool blue.
You may find that all the text information about your service that you thought would be extremely helpful is actually an obstacle for visitors as they scroll right past it to get to the pricing and testimonial information.
There’s a whole collection of tools which work great with ClickFunnels.
Areas That Get More Attention
You can use the heat mapping tool that can also be found on CrazyEgg to discover which areas of landing pages or your homepage gets the most or least attention.
With this full-proof evidence, you can rearrange elements of your website pages, so CTA’s and any actionable elements are in the areas that have the most attention to keep people on the website and take action.
If you also notice that visitors click on elements that aren’t clickable and get a lot of attention, you can take this data and add links to these elements to give visitors what they want and improve their experience.
Survey Questions

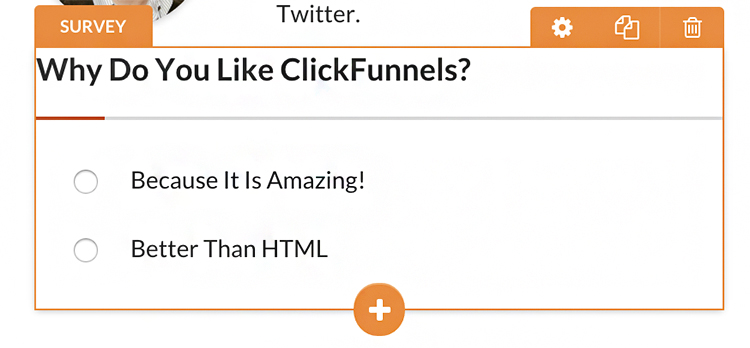
To get further information on why visitors come to your website and how they interact is to ask them by using surveys.
You can ask customers questions such as what made them look for a solution, how has your service helped with that solution, their job role or title and more.
The more you understand what it is that attracts visitors to land on your website and how your service helps relieve their pain points and achieve their goals, the more you will be able to convey better headlines and messages to trigger emotions.
Internal Site Search

Image Source: MOZ
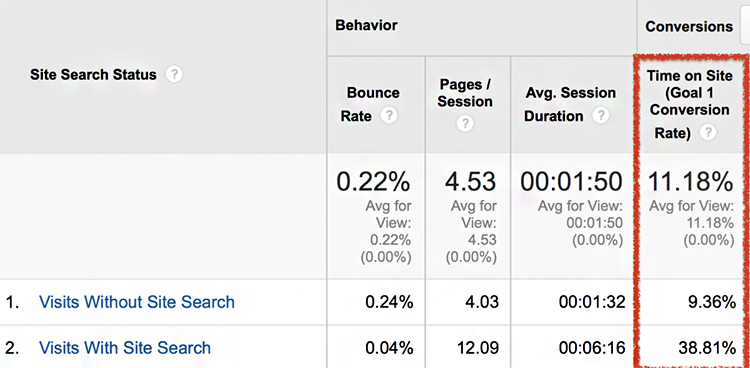
If you haven’t got an internal site search already, I suggest you get one as according to eConsultancy 30% of e-commerce visitors will use it and will be 5 to 6 times more likely to convert.
Internal site search makes it easier for visitors who already know what they are looking for and just want to buy it.
Having said this, though, internal site search is still an underestimated conversion tool.
Emphasis On The Search Box
If you already have an internal site search then good for you, although I’m sure it can do with a lot more love and care.
One way to optimize your internal search for conversions it to have it stand out so that those who are looking to search and easily locate it.
It’s crazy how many websites I have come across that have a hidden internal search box… it can be annoying when you want to find something in particular.
To back this theory up, Black Forest Décor put more emphasis on their internal search box which resulted in a 20% increase in conversions.
Learn More About Your Visitors To Getting Higher Conversion Rates
I believe if there is one to take away from this blog post, it is that to optimize your website for conversion you need to know everything there is to know about your visitors; the traffic sources they come, their pain points, their goals, their behaviours and their demographics.
The more you drill down into the data in Google Analytics and other analytical tools you are using, the more evidence you will have to create hypotheses for split testing.
Numbers and data tell many stories about your customer’s and prospect’s thoughts and actions.
What methods do you use to lift conversions on your sales and landing pages??
Share your thoughts and ideas by leaving your comments below.

