You may have heard various thought leaders emphasize the importance of making data-driven decisions instead of relying on your gut feelings.
That sounds great in theory but it’s not always clear how entrepreneurs are supposed to implement this advice in practice.
That’s why today we are going to discuss five ways in which you can use analytics to grow your business…
#1: Zero-In on Your Most Profitable Customers

When you are just starting out, you don’t have any data so all you can do is make your best guess as to who your dream customers are and then market your products and services to them.
However, as your business grows and you start accumulating data, you should revise your definition of a dream customer based on which customers are the most profitable ones.
It’s quite likely that if you look at your sales data, you’ll find a Pareto distribution where a minority of your customers are responsible for the majority of your revenue.
You want to identify your most profitable customers, figure out what are the traits that they have in common, and create a dream customer persona based on those traits.
Then, use that dream customer persona to improve the targeting of your marketing campaigns so that you can attract more customers who fit that profile!
#2: Optimize Your Sales Funnel
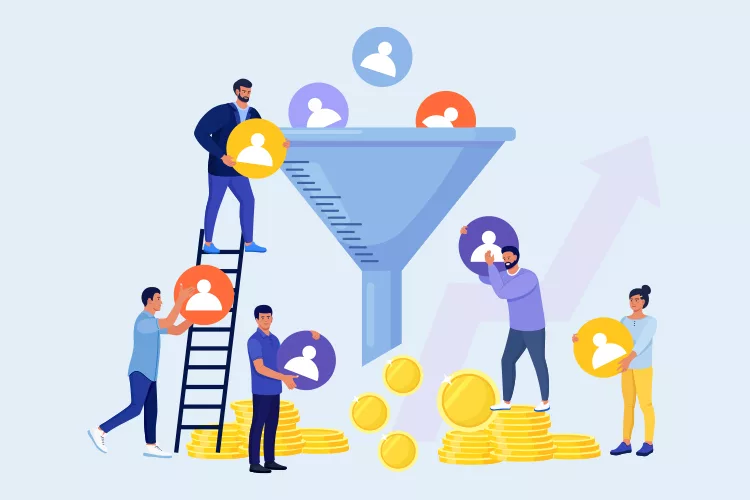
First, you need to get the baseline conversion rates of your sales funnel, which you can do by driving traffic to it.
Once you know what your visitor-to-lead, lead-to-customer, and customer-to-repeat-customer conversion rates are, you can start optimizing your sales funnel with A/B testing.
A/B testing, also known as split testing, is a conversion rate optimization method where you create two versions of the same page that are identical except for the variable that you are testing and then drive an equal amount of traffic to both versions to see which one converts better.
For example, if you want to optimize a particular page in your sales funnel, it makes sense to test a bunch of different headlines and then keep the winning one.
The same goes for the page layout, color scheme, images, body copy, social proof, etc. You should test everything.
Keep in mind that although you might feel that you know what’s going to convert the best, you don’t actually know until you put your hypothesis to the test and look at the results.
Generally speaking, the fewer assumptions you make and the more A/B tests you run, the better your sales funnel is going to convert and the more money you are going to make!
#3: Increase Customer Lifetime Value
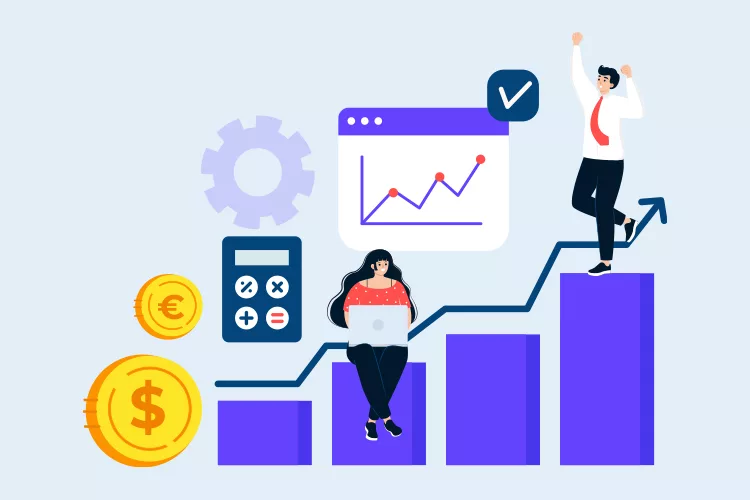
The ratio between your customer lifetime value and your customer acquisition cost is the most important business metric of them all. Why?
Because the more money you get from each customer, the more money you can spend on customer acquisition.
And, as Dan Kennedy put it, whoever can spend the most to acquire a customer wins.
Here’s how he explained it to our co-founder Russell Brunson:
But how can you use analytics to increase your customer lifetime value?
Improve Your Onboarding
First, look at the data related to onboarding.
Analyze it and see if you can uncover patterns.
Is there anything that happens during the onboarding process that is likely to lead to that customer having a higher-than-average customer lifetime value?
Likewise, is there anything that happens during the onboarding process that is likely to lead to that customer having a lower-than-average customer value?
Once you identify the factors that have an impact on customer lifetime value, you want to optimize your onboarding process accordingly.
Pre-Emptively Counter Churn
Churn is the bane of all recurring revenue businesses. If you let it get out of control, it might not only offset growth but also lead to a decline in revenue and put your company at risk.
That’s why it’s so important to be proactive about reducing it and take measures to counter it pre-emptively.
Compare the data of customers who churn the earliest with the data of customers who churn the latest. What are the factors that make someone more likely to churn?
You will probably see people using your product less and less over time until they finally cancel their subscriptions, in which case you want to set up a system that allows you to detect a decline in usage and re-engage those customers before it’s too late.
You might also discover that it’s not that deep: maybe people’s credit cards expire, they forget to update their payment details and their subscriptions get canceled automatically without them even realizing it.
You can prevent this by setting up a system for keeping track of credit card expiration dates and automatically reminding customers to renew their payment details before their cards expire.
While churn is normal and inevitable, you can probably significantly reduce yours by simply identifying patterns and taking measures to address these issues before customers cancel their subscriptions!
Prioritize What’s Most Important to Your Customers
Sometimes business owners struggle to understand what is most important to their customers.
That can lead to them wasting resources on developing new features that no one cares about or even launching entirely new products that no one wants.
Fortunately, you can use analytics to avoid that and prioritize stuff that actually matters to your customers instead.
Start by collecting usage data for your website, online store, or app, and then look at the heatmaps to see if people are using it the way you intended.
You might discover that they find some of the elements of your user interface confusing, in which case you want to make it easier to navigate.
Then, look at which features your customers use the most and which features they use the least.
You might find a Pareto distribution in feature usage: it may turn out that your customers primarily use a few key features and barely touch the rest.
In that case, it makes sense to prioritize improving those key features and remove the rest of them to declutter your user interface.
Finally, make sure that you save and catalog all customer feedback that you receive, regardless of the channel.
Social media posts and DMs, emails, customer support tickets, all of it should go into one centralized database.
Once you build that database, you can use text analytics software to make sense of all the feedback. It should help you understand what is most important to your customers!
#4: Create More Accurate Future Projections
If you want to build a sustainable business, you need to be strategic about it.
Analytics can help you with that because the more historical data you have, the more accurate future projections you can create.
Make sure to remove highly unusual, one-off events from your data before you start analyzing it because they can distort the patterns.
Say, if some celebrity randomly mentioned your product and it went viral because of that, you should exclude that spike in sales from your data because that is unlikely to happen again.
However, if you paid an influencer to give you a shout-out and it resulted in a large number of sales, you should keep that spike in your data if you intend to continue using influencer marketing in the future.
If you want to be conservative in your analysis – which we would recommend – you can include negative one-off events in your data while excluding the positive ones. This can help you prepare to weather bad luck without relying on good luck.
Once you understand the patterns that are present in your historical data, you can start extrapolating them into the future.
There’s the obvious stuff like using the average churn rate, the average year-on-year growth, seasonal changes in sales, etc. to make predictions. But you can also create more sophisticated projections.
For example, assuming that your conversion rates remain the same if you drive 3x more traffic to your sales funnel, that should lead to a 3x increase in sales. Pretty straightforward. But will that also lead to a 3x increase in the customer support load?
You can look at the historical data, extrapolate from the existing pattern, and use that to decide whether to hire more customer support agents.
Of course, it goes without saying that no matter how powerful your data analysis software is, it’s not a crystal ball and you shouldn’t treat it as such.
There’s always a possibility that a black swan event will change everything. No one knows what the future holds so it’s best to err on the side of caution and play it safe!
#5: Set Realistic Sales Targets
You can also use analytics to set realistic sales targets.
First, look at the historical data and extrapolate from it to see what would be the most likely outcome if your salespeople simply continued doing what they have been doing so far.
Then play with the numbers to see what might be possible if they pushed themselves a little bit.
For example, if we assume that the conversion rates are going to remain the same, then making 20% more cold calls should lead to 20% more meetings with clients and 20% more sales.
Setting an annual sales target based on that could motivate your salespeople to get out of their comfort zone. It may be a stretch goal but it should be achievable.
Once you have your annual sales target, break it down into quarterly, monthly, and weekly targets.
Then, create a sales plan that outlines the action steps that your salespeople should take every day, week, and month in order to hit those targets.
Finally, set up daily, weekly, monthly, and quarterly reviews to keep everyone accountable.
These reviews will help your salespeople stay on track throughout the year until they reach their annual sales target.
One quick note: before you do all this, run simulations based on historical data to see what would be the most likely downstream effects of your desired increase in sales. You need to make sure that your business can handle it!
Grow Your Business With ClickFunnels!
ClickFunnels is an all-in-one marketing platform that has everything you need to grow your business, including:
Sales Funnels
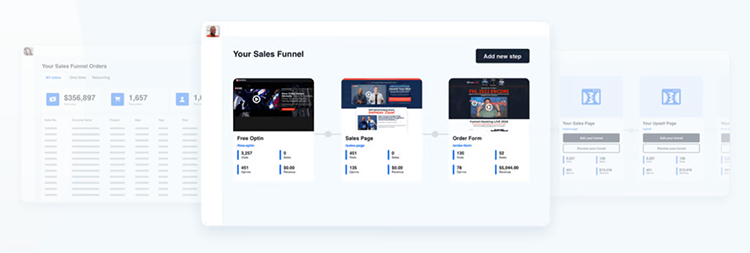
Our software features a library of proven sales funnel templates that you can customize with our drag-and-drop page editor.
And if you want to create a custom funnel from scratch, you can do that with our visual funnel builder.
There’s also an email marketing functionality, so you won’t need to pay for a separate email marketing app!
A/B Testing
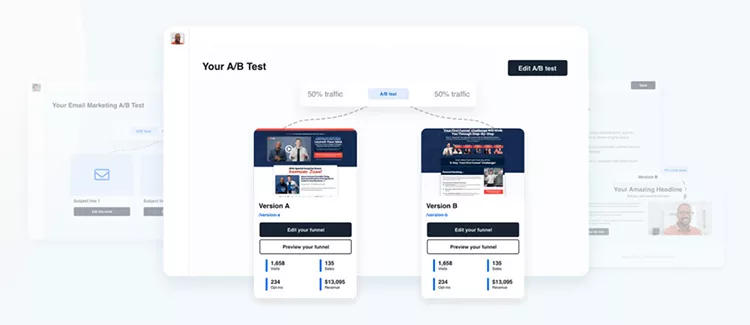
Our A/B testing functionality enables you to optimize your entire sales funnel: from your landing pages to your emails to your sales pages to your downsells, upsellls, and cross-sells.
What’s best is that you can test more than two versions of a given variable at the same time, which can help you optimize your sales funnel faster!
Analytics
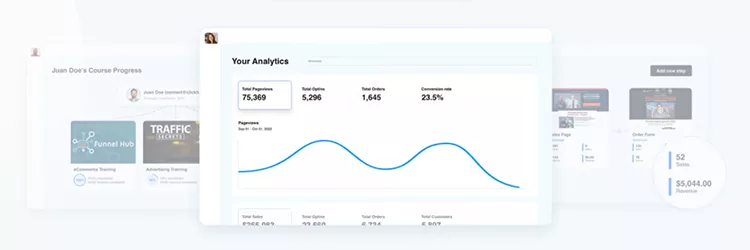
Finally, you can use our analytics functionality to collect business data, analyze it, and create future projections!
Try ClickFunnels Risk-Free!
Let’s be real:
We are biased in favor of our software.
So we understand if you take what we say about it with a grain of salt.
Fortunately, we have a free 14-day trial, so you don’t have to take our word for it.
You can go and see ClickFunnels for yourself without any risk!
So what are you waiting for? 🧐
